概要
LinuxやUNIXシステムにおいてリソースをモニタリングするためには、topコマンドやiotopを使います。ネットワークのトラフィックはこれらのコマンドではわかりません。kernelの累計トラフィック数などの数値は簡単に表示できますが視覚的に分かりづらいです。そこで紹介するのがiftopです。
この記事では、インストール方法と代表的なオプションを簡単に紹介します。
インストールと起動
Debian, Ubuntu
# aptitude install -y iftop
Mac
# port install iftop
起動
# iftop
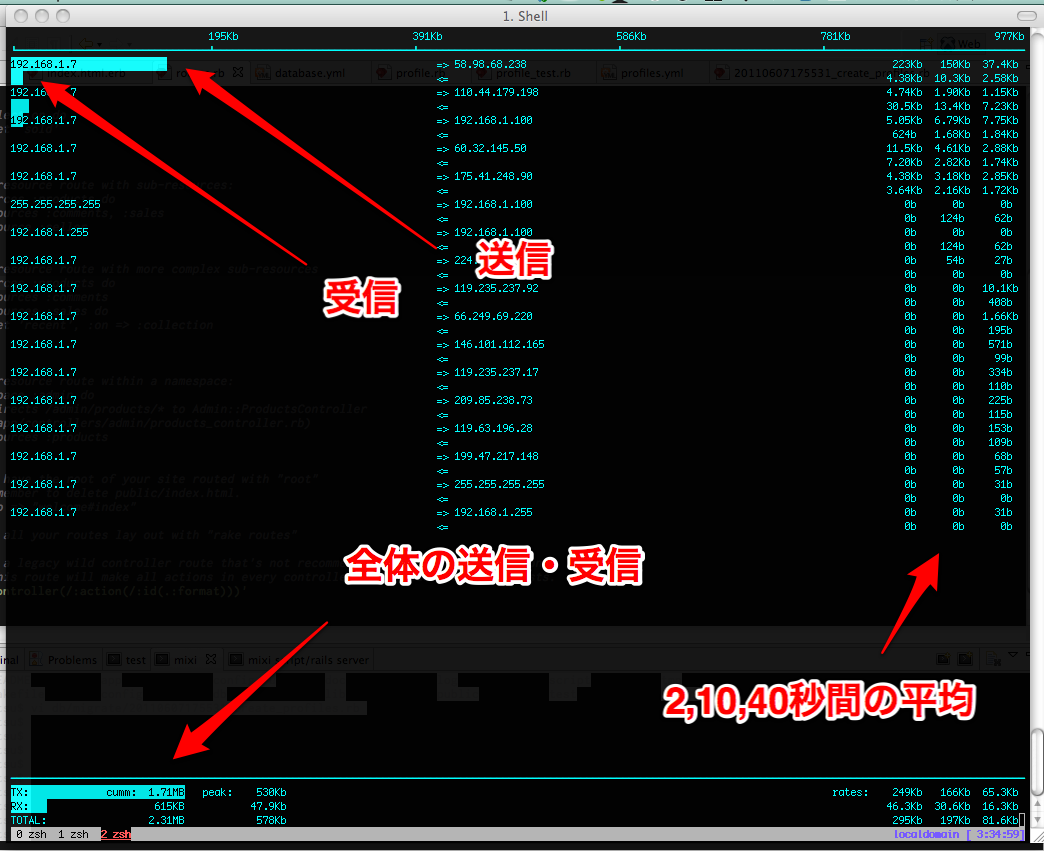
表示オプション
t スイッチ

トラフィックの表示方式を変えられます。デフォルトだと1ホストに対して送受信それぞれを1行で表示していますが、1行にまとめたりできます。
p スイッチ
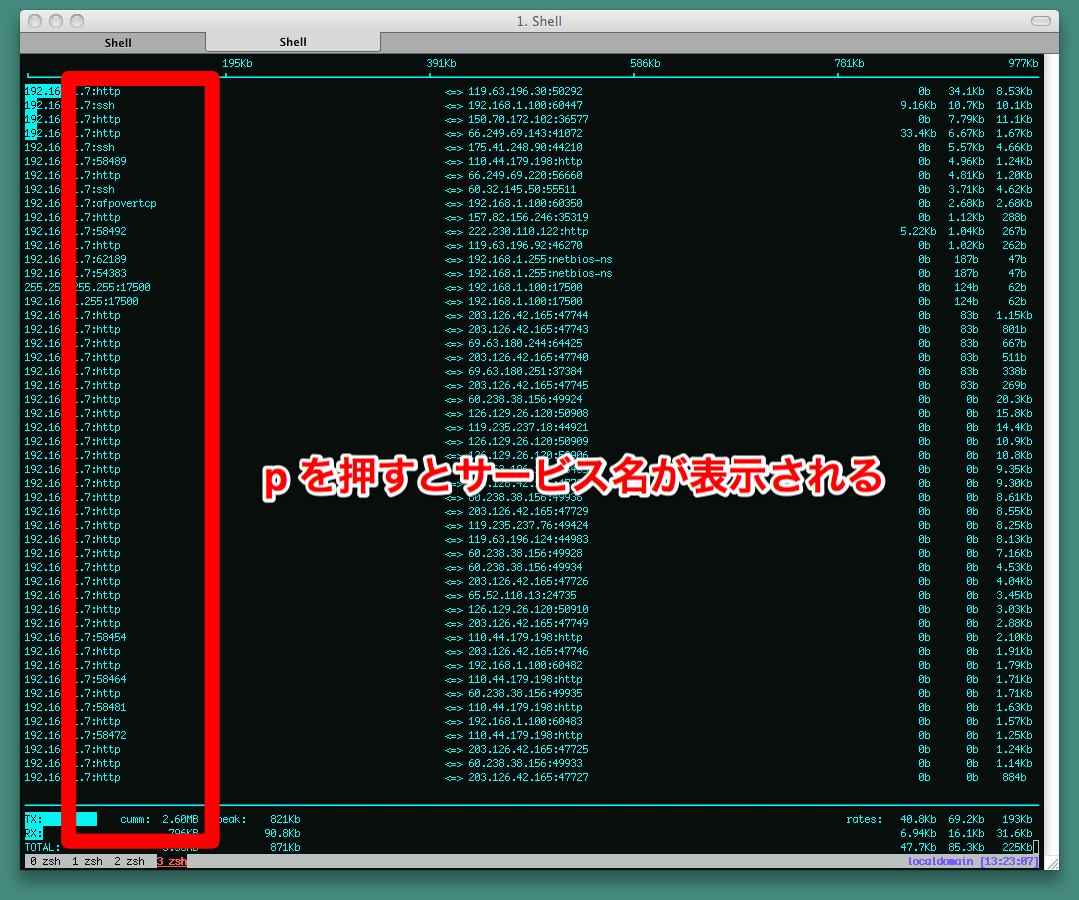
ポート番号に対応したサービス名が表示されます。どんなサービスのトラフィックが多いのかが一目瞭然です。
数字スイッチ
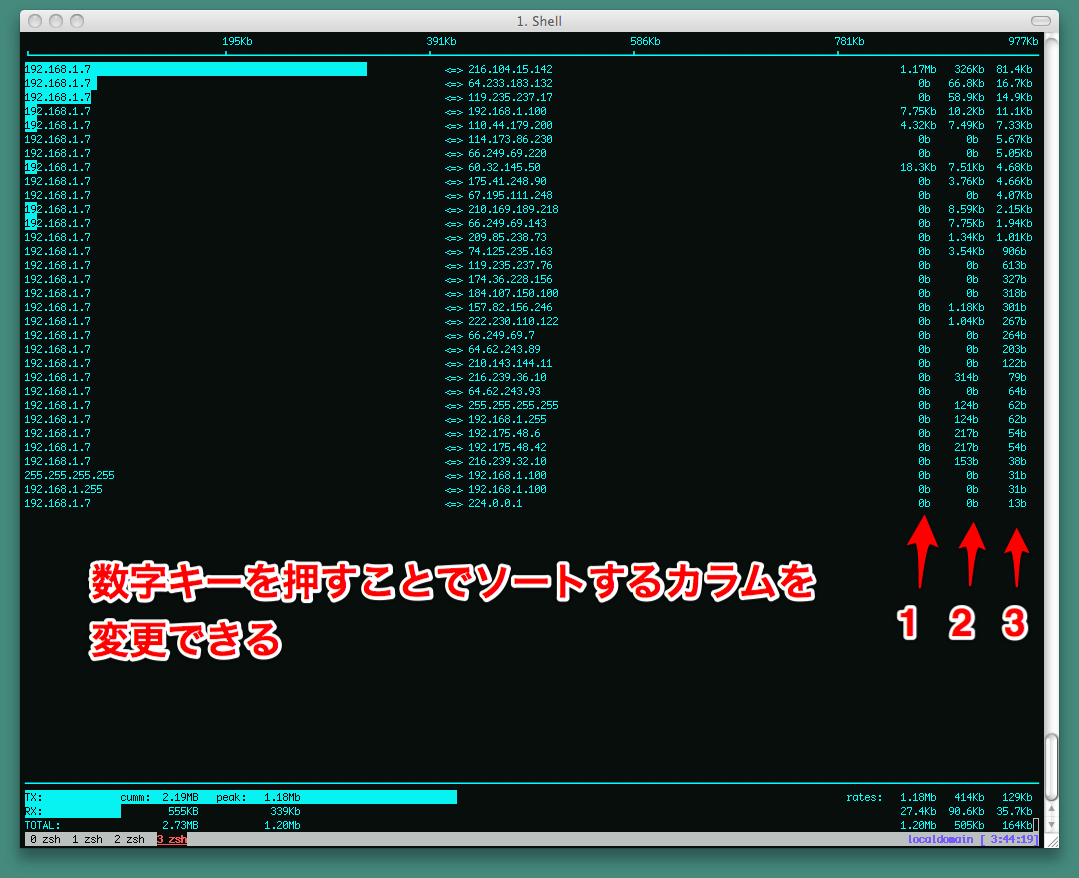
並べ替え方法を選択できます。デフォルトでは1です。
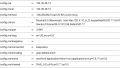
オプション一覧
Host display:                          General:
 n - toggle DNS host resolution         P - pause display
 s - toggle show source host            h - toggle this help display
 d - toggle show destination host       b - toggle bar graph display
 t - cycle line display mode            B - cycle bar graph average
                                        T - toggle cummulative line totals
Port display:                           j/k - scroll display
 N - toggle service resolution          f - edit filter code
 S - toggle show source port            l - set screen filter
 D - toggle show destination port       L - lin/log scales
 p - toggle port display                ! - shell command
                                        q - quit
Sorting:
 1/2/3 - sort by 1st/2nd/3rd column
 < - sort by source name
 > - sort by dest name
 o - freeze current order
Enjoy!


Comments